How Race Matters: What We Can Learn from Mental Health America’s Screening in 2020
During the COVID-19 pandemic, Mental Health America has witnessed unprecedented numbers of people who come to its website (www.mhascreening.org) to take a voluntary, free, anonymous mental health screening.
From January to December 2020, a total of over 2.6 million people completed a mental health screen.
Part of the mission of the MHA online screening program is to further data-driven, upstream, population-level efforts to improve mental health. MHA Screening is not only the largest existing data set of help-seeking individuals for mental health conditions, but it collects data in real time – as people are actively taking screens. This allows MHA to engage in rapid analysis and dissemination of information – so we can recognize and react to trends in mental health quickly.
In our screening program, we use voluntary demographic questions and additional surveys to learn more about people who are often not captured in traditional research. Our data provides us an opportunity to better understand and disseminate findings on unmet needs and gaps in care among specific populations, such as youth, Black, Indigenous and people of color, trauma survivors and LGBTQ+ individuals. Our work is designed primarily to provide the earliest supports to people in need.
As part of this rapid analysis and dissemination of screening data, we are sharing some of our analyses of screening data with a focus on race and ethnicity. This analysis is not complete - the hope is that we will provide some of the trends we are seeing for researchers, partners, journalists, or providers, to work towards creating new interventions for mental health and furthering research.
If something in this data speaks to you or raises questions that you would like us to explore further, please email Maddy Reinert at mreinert@mhanational.org or Theresa Nguyen at tnguyen@mhanational.org
Demographics
The following analysis is from the 1,093,519 screens for anxiety and depression where race/ethnicity was reported from January 1st to December 31st, 2020.
The race/ethnicity demographics of our anxiety and depression screening population has shifted in 2020 compared to the 2019 average. In 2020, Asian or Pacific Islander screeners made up 17 percent of the anxiety and depression screening population, compared to 10 percent in 2019. Screeners who identified their race as “Other” also made up a greater proportion of anxiety and depression screeners in 2020 compared to 2019, at about 5 percent.
|
Race/Ethnicity among Anxiety (GAD-7) and Depression (PHQ-9) Screeners |
2019 Count |
2019 Percentage |
2020 Count |
2020 Percentage |
|
Asian or Pacific Islander |
21,835 |
10.21% |
188,187 |
17.21% |
|
Black or African American (non-Hispanic) |
20,459 |
9.57% |
95,547 |
8.74% |
|
Hispanic or Latino |
28,341 |
13.26% |
139,084 |
12.72% |
|
More than one of the above |
10,487 |
4.90% |
49,338 |
4.51% |
|
Native American or American Indian |
2,422 |
1.13% |
12,076 |
1.10% |
|
Other |
6,815 |
3.19% |
55,959 |
5.12% |
|
White (non-Hispanic) |
123,451 |
57.74% |
553,328 |
50.60% |
|
Grand Total |
213,810 |
100.00% |
579793 |
100.00% |
From these screens, we have found:
|
Anxiety
MHA uses the GAD-7 as its anxiety screening tool. For nearly all racial/ethnic groups, rates of moderate to severe anxiety increased during the last few days of February 2020 and into the beginning of March, as people became more aware of the pandemic and its spread into the United States. All racial/ethnic groups also experienced an increase in the rate of moderate to severe anxiety from the first weeks of May into the first weeks of June.
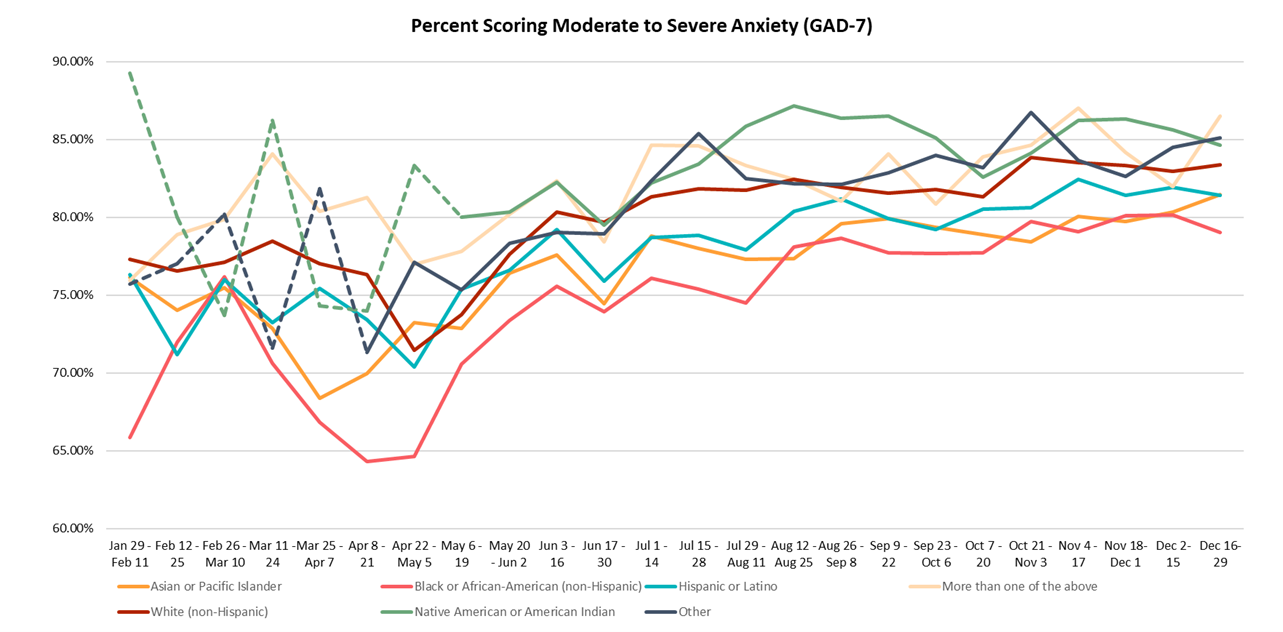
*Dotted line to represent where N < 100 people.
The December 2020 average for moderate to severe anxiety was higher than the monthly average for May-November for Asian or Pacific Islander screeners. For most other racial/ethnic groups, the November average was higher.
However, rates of moderate to severe anxiety continue to be much higher than the 2019 average for screeners of every race/ethnicity. The proportion of people scoring with moderate to severe symptoms of anxiety was highest among Native American or American Indian screeners in 2020 (84%). The largest increases in the proportion of people scoring for moderate to severe anxiety between 2019 and 2020 was for screeners who identified their race as Other (4.67% increase) and Asian or Pacific Islander screeners (4.53% increase).
|
Asian or Pacific Islander |
Black or African-American (non-Hispanic) |
Hispanic or Latino |
More than one of the above |
White (non-Hispanic) |
Native American or American Indian |
Other |
|
|
Jan 29 - Feb 11 |
76.11% |
65.83% |
76.30% |
75.94% |
77.31% |
89.29% |
75.71% |
|
Feb 12 - 25 |
74.02% |
71.97% |
71.18% |
78.91% |
76.56% |
80.00% |
77.03% |
|
Feb 26 - Mar 10 |
75.48% |
76.19% |
75.99% |
79.85% |
77.12% |
73.68% |
80.18% |
|
Mar 11 - 24 |
72.85% |
70.61% |
73.24% |
84.06% |
78.46% |
86.21% |
71.60% |
|
Mar 25 - Apr 7 |
68.35% |
66.83% |
75.45% |
80.41% |
77.02% |
74.29% |
81.82% |
|
Apr 8 - 21 |
69.96% |
64.29% |
73.43% |
81.25% |
76.31% |
74.00% |
71.34% |
|
Apr 22 - May 5 |
73.24% |
64.62% |
70.36% |
76.95% |
71.45% |
83.33% |
77.09% |
|
May 6 - 19 |
72.84% |
70.55% |
75.37% |
77.80% |
73.73% |
80.00% |
75.33% |
|
May 20 - Jun 2 |
76.40% |
73.39% |
76.61% |
80.18% |
77.61% |
80.34% |
78.33% |
|
Jun 3 - 16 |
%77.59% |
75.55% |
79.23% |
82.35% |
80.35% |
82.24% |
79.01% |
|
Jun 17 - 30 |
74.43% |
73.94% |
75.91% |
78.43% |
79.67% |
79.50% |
78.93% |
|
Jul 1 - 14 |
78.80% |
76.08% |
78.71% |
84.63% |
81.34% |
82.20% |
82.34% |
|
Jul 15 - 28 |
78.00% |
75.38% |
78.85% |
84.59% |
81.84% |
83.44% |
85.40% |
|
Jul 29 - Aug 11 |
77.30% |
74.48% |
77.90% |
83.31% |
81.75% |
85.86% |
82.47% |
|
Aug 12 - Aug 25 |
77.35% | 78.07% | 80.36% | 82.44% | 82.44% | 87.17% | 82.18% |
|
Aug 26 - Sep 8 |
79.58% | 78.66% | 81.17% | 81.04% | 81.93% | 86.38% | 82.12% |
|
Sep 9 - Sep 22 |
79.89% | 77.73% | 79.91% | 84.09% | 81.57% | 86.52% | 82.86% |
|
Sep 23 - Oct 6 |
79.36% | 77.67 | 79.20% | 80.84% | 81.78% | 85.11% | 83.96% |
|
Oct 7 - 20 |
78.91% | 77.74% | 80.50% | 83.88% | 81.33% | 82.56% | 83.20% |
|
Oct 21 - Nov 3 |
78.42% | 79.72% | 80.60% | 84.64% | 83.86% | 84.12% | 86.75% |
|
Nov 4 - 17 |
80.04% | 79.06% | 82.45% | 87.02% | 83.86% | 86.25% | 83.68% |
|
Nov 18 - Dec 1 |
79.72% | 80.10% | 81.41% | 84.15% | 83.34% | 86.33% | 82.65% |
|
Dec 2 - Dec 15 |
80.33% | 80.13% | 81.93% | 81.99% | 82.97% | 85.61% | 84.50% |
|
Dec 16 - Dec 29 |
81.46% | 79.02% | 81.39% | 86.49% | 83.39% | 84.65% | 85.10% |
|
Avg May |
74.14% |
70.06% |
74.82% |
78.70% |
74.26% |
80.30% |
76.16% |
|
Avg June |
75.89% |
74.31% |
77.03% |
80.12% |
79.89% |
81.14% |
78.89% |
|
Avg July |
78.35% |
75.49% |
78.73% |
84.11% |
81.70% |
83.77% |
84.22% |
|
Avg August |
77.42% | 77.09% | 79.59% | 82.56% | 81.97% | 86.21% | 81.27% |
|
Avg September |
80.06% | 77.98% | 79.92% | 82.83% | 81.91% | 86.61% | 83.59% |
|
Avg October |
78.99% | 78.43% | 80.50% | 83.05% | 82.02% | 83.83% | 84.60% |
|
Avg November |
79.36% | 79.64% | 81.74% | 85.87% | 83.55% | 85.11% | 83.73% |
|
Avg December |
80.89% | 79.40% | 81.46% | 83.93% | 83.10% | 85.00% | 84.47% |
|
2020 Average |
78.24% | 76.55% | 79.12% | 82.76% | 80.84% | 84.00% | 82.58% |
|
2019 Average |
73.71% |
72.94% |
76.81% |
80.67% |
77.84% |
80.88% |
77.91% |
*Cells highlighted in yellow where N < 100 people.
Depression
MHA uses the PHQ-9 as its depression screening tool. This nine-question instrument is one of the most used depression screening tools. There is also a shorter version of it, the PHQ-2, which along with the GAD-2 is used as a brief screening tool by the U.S. Census Bureau (2020 Pulse Survey) and others.
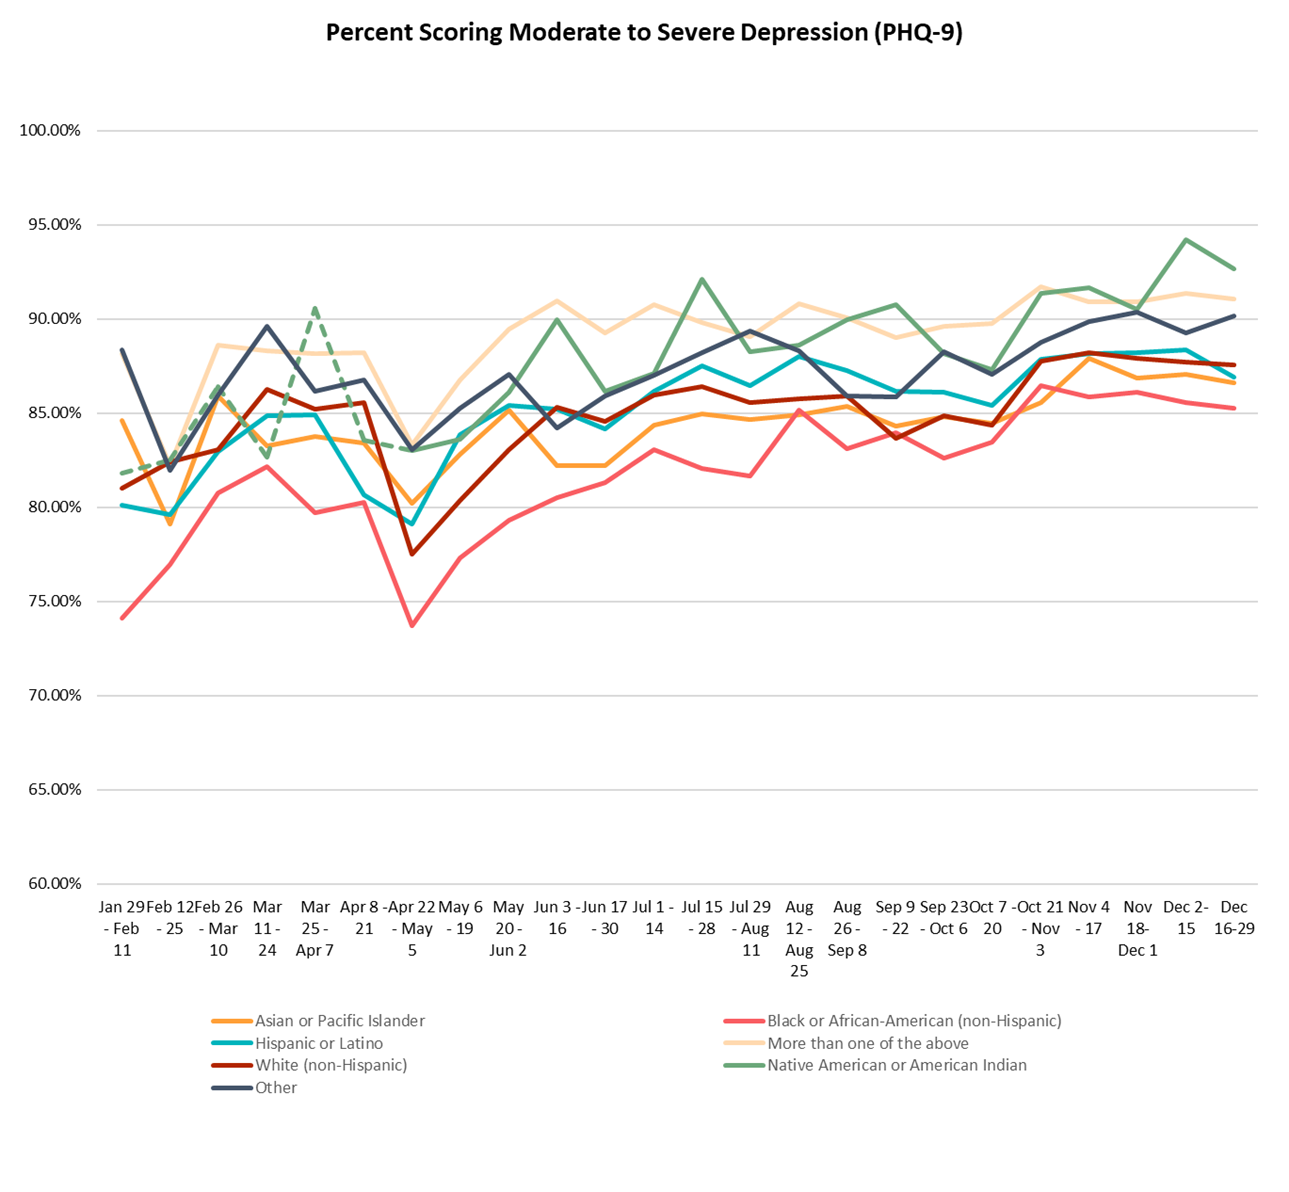
*Dotted line to represent where N < 100 people.
The December average for moderate to severe depression was higher than the monthly average for May-November for screeners identifying as more than one race and Native American or American Indian screeners. For most other racial/ethnic groups, the November 2020 average was higher.
The proportion of people scoring with moderate to severe symptoms of depression was highest among screeners who identified with more than one race in 2020 (90%).
Average rates of moderate to severe depression were lower in 2020 than in 2019 for screeners of nearly every race/ethnicity, except for Native American or American Indian screeners. However, the percentage of people scoring with moderate to severe symptoms of depression in December 2020 was higher than the 2019 average for every racial/ethnic group.
|
Depression |
Asian or Pacific Islander |
Black or African-American (non-Hispanic) |
Hispanic or Latino |
More than one of the above |
White (non-Hispanic) |
Native American or American Indian |
Other |
|
Jan 29 - Feb 11 |
84.63% |
74.11% |
80.13% |
88.15% |
81.01% |
81.82% |
88.34% |
|
Feb 12 - 25 |
79.11% |
76.98% |
79.62% |
82.22% |
82.42% |
82.54% |
81.94% |
|
Feb 26 - Mar 10 |
85.91% |
80.78% |
82.95% |
88.61% |
83.07% |
86.44% |
85.99% |
|
Mar 11 - 24 |
83.27% |
82.19% |
84.87% |
88.31% |
86.26% |
82.69% |
89.64% |
|
Mar 25 - Apr 7 |
83.75% |
79.71% |
84.91% |
88.18% |
85.24% |
90.57% |
86.19% |
|
Apr 8 - 21 |
83.41% |
80.29% |
80.68% |
88.20% |
85.56% |
83.58% |
86.77% |
|
Apr 22 - May 5 |
80.23% |
73.70% |
79.13% |
83.30% |
77.50% |
83.04% |
83.08% |
|
May 6 - 19 |
82.79% |
77.31% |
83.85% |
86.77% |
80.35% |
83.62% |
85.26% |
|
May 20 - Jun 2 |
85.16% |
79.30% |
85.42% |
89.48% |
83.06% |
86.12% |
87.05% |
|
Jun 3 - 16 |
82.21% |
80.51% |
85.23% |
90.98% |
85.32% |
89.96% |
84.22% |
|
Jun 17 - 30 |
82.21% |
81.30% |
84.15% |
89.28% |
84.57% |
86.18% |
85.92% |
|
Jul 1 – 14 |
84.38% |
83.09% |
86.15% |
90.78% |
85.97% |
87.11% |
87.01% |
|
Jul 15 - 28 |
84.97% |
82.06% |
87.50% |
89.81% |
86.41% |
92.11% |
88.21% |
|
Jul 29 - Aug 11 |
84.67% |
81.67% |
86.46% |
89.06% |
85.59% |
88.26% |
89.36% |
|
Aug 12 - Aug 25 |
84.91% | 85.15% | 88.01% | 90.83% | 85.74% | 88.63% | 88.32% |
|
Aug 26 - Sep 8 |
85.39% | 83.10% | 87.27% | 90.08% | 85.92% | 89.96% | 85.92% |
|
Sep 9 - Sep 22 |
84.34% | 83.97% | 86.17% | 89.03% | 83.66% | 90.75% | 85.89% |
|
Sep 23 - Oct 6 |
84.81% | 82.64% | 86.14% | 89.62% | 84.85% | 88.16% | 88.25% |
|
Oct 7 - Oct 20 |
84.46% | 83.47% | 85.43% | 89.79% | 84.37% | 87.32% | 87.06% |
|
Oct 21 - Nov 3 |
85.56% | 86.45% | 87.86% | 91.73% | 87.79% | 91.38% | 88.78% |
|
Nov 4 - Nov 17 |
87.92% | 85.86% | 88.17% | 90.92% | 88.20% | 91.67% | 89.86% |
|
Nov 18 - Dec 1 |
86.86% | 86.13% | 88.21% | 90.93% | 87.90% | 90.52% | 90.36% |
|
Dec 2 - Dec 15 |
87.05% | 85.56% | 88.34% | 91.35% | 87.70% | 94.20% | 89.29% |
|
Dec 16 - 29 |
86.60% | 85.28% | 86.91% | 91.08% | 87.56% | 92.65% | 90.15% |
|
Avg May |
83.31% |
76.97% |
83.41% |
87.24% |
80.30% |
83.76% |
85.59% |
|
Avg June |
82.35% |
80.82% |
84.59% |
90.09% |
84.91% |
88.17% |
85.39% |
|
Avg July |
84.64% |
82.47% |
86.95% |
90.02% |
86.14% |
89.72% |
87.87% |
|
Avg August |
84.94% | 83.41% | 87.18% | 90.15% | 85.74% | 88.64% | 88.08% |
|
Avg September |
84.60% | 83.56% | 86.42% | 89.37% | 84.51% | 89.87% | 86.88% |
|
Avg October |
85.05% | 84.18% | 86.41% | 90.33% | 85.47% | 88.73% | 87.43% |
|
Avg November |
87.15% | 86.11% | 88.16% | 91.14% | 88.19% | 91.59% | 80.17% |
|
Avg December |
86.76% | 85.45% | 87.82% | 91.27% | 87.49% | 92.79% | 89.66% |
|
2020 Average |
84.98% | 83.18% | 86.33% | 89.89% | 85.42% | 89.34% | 87.89% |
|
2019 Average |
85.52% |
83.25% |
87.08% |
90.97% |
86.92% |
88.02% |
88.18% |
*Cells highlighted in yellow where N < 100 people.
Suicidal Ideation
Suicidal or self-harm thinking can be associated with many mental health conditions, but it is a specific question in the depression screening tool, the PHQ-9. We have seen an increase in the numbers of people who – in answering the question – report suicidal or self-harm thinking on either "more than half the days" or "nearly every day" of the previous two weeks.
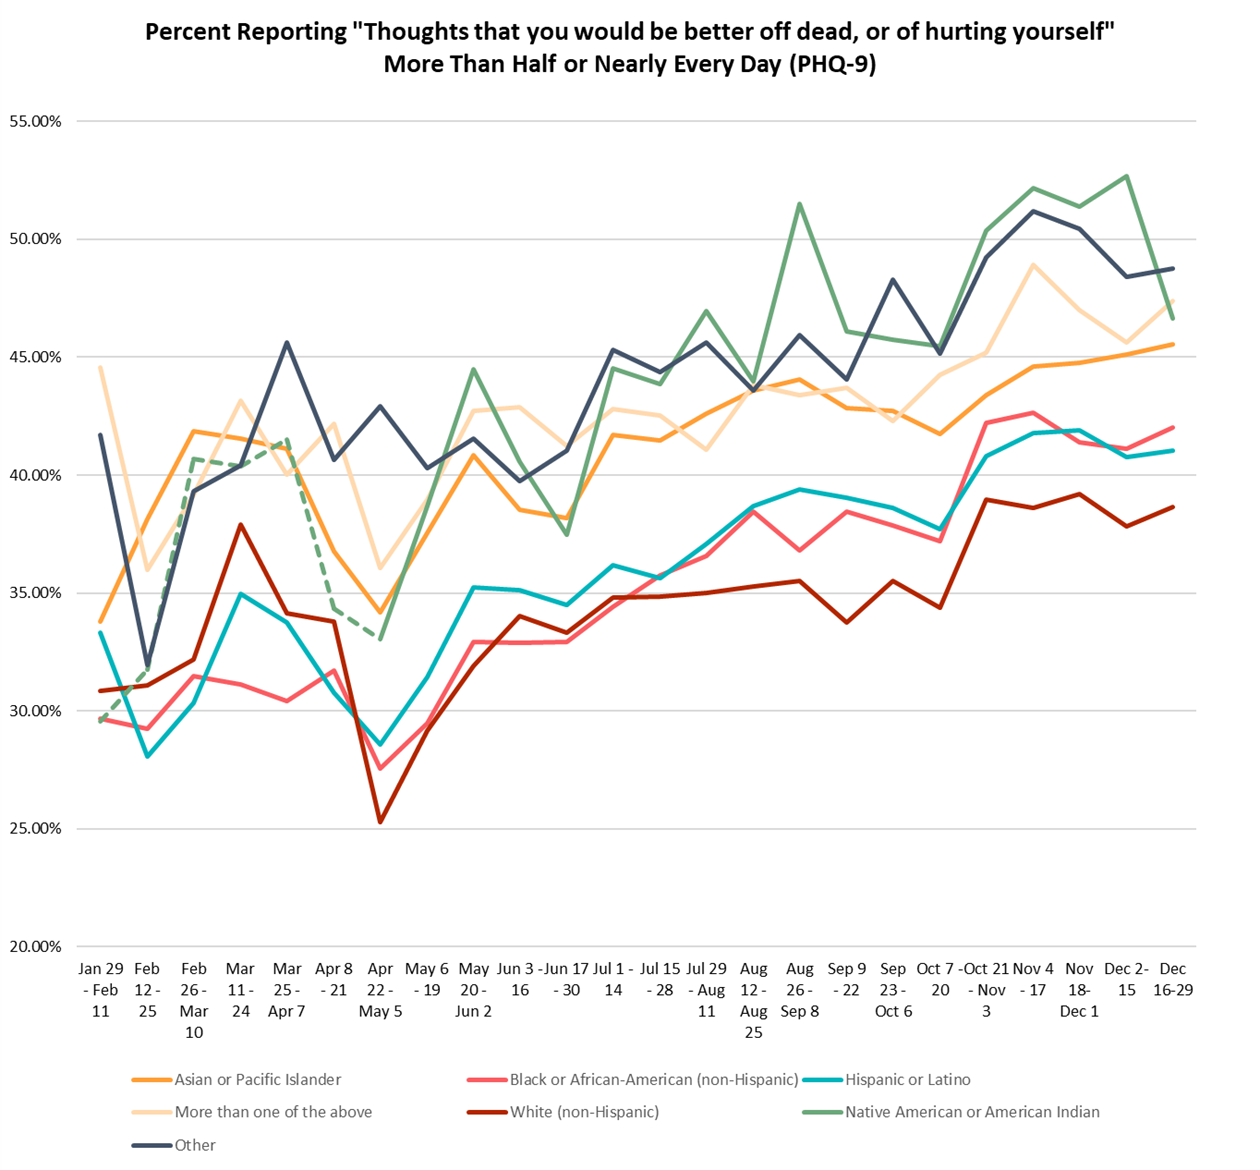
*Dotted line to represent where N < 100 people.
The December average for suicidal ideation was higher than the August-November 2020 averages for Asian or Pacific Islander screeners. For all other racial/ethnic groups, suicidal ideation was higher in November than in December.
Since the end of May 2020, nearly every racial/ethnic group has been experiencing consistently higher rates of suicidal ideation than the 2019 average (excluding Native American or American Indian screeners and screeners who identified as another race/ethnicity, who experienced consistently higher rates of suicidal ideation than the 2019 average beginning in July).
The proportion of people reporting frequent thoughts of suicide or self-harm was highest among Native American or American Indian screeners in 2020 (46%). The largest increases in the proportion of people experiencing suicidal ideation between 2019 and 2020 was for Native American or American Indian screeners (7.5% increase) and Black or African American screeners (6.89% increase).
|
Suicidal Ideation |
Asian or Pacific Islander |
Black or African-American (non-Hispanic) |
Hispanic or Latino |
More than one of the above |
White (non-Hispanic) |
Native American or American Indian |
Other |
|
Jan 29 - Feb 11 |
33.78% |
29.69% |
33.33% |
44.55% |
30.84% |
29.55% |
41.72% |
|
Feb 12 - 25 |
38.13% |
29.26% |
28.08% |
36.00% |
31.07% |
31.75% |
31.94% |
|
Feb 26 - Mar 10 |
41.88% |
31.46% |
30.35% |
39.15% |
32.17% |
40.68% |
39.30% |
|
Mar 11 - 24 |
41.55% |
31.12% |
34.96% |
43.15% |
37.90% |
40.38% |
40.41% |
|
Mar 25 - Apr 7 |
41.13% |
30.43% |
33.74% |
40.00% |
34.15% |
41.51% |
45.61% |
|
Apr 8 - 21 |
36.75% |
31.72% |
30.76% |
42.18% |
33.79% |
34.33% |
40.65% |
|
Apr 22 - May 5 |
34.17% |
27.54% |
28.57% |
36.05% |
25.27% |
33.04% |
42.93% |
|
May 6 - 19 |
37.55% |
29.48% |
31.44% |
38.97% |
29.15% |
38.68% |
40.29% |
|
May 20 - Jun 2 |
40.84% |
32.94% |
35.24% |
42.73% |
31.90% |
44.50% |
41.53% |
|
Jun 3 - 16 |
38.54% |
32.88% |
35.11% |
42.88% |
34.01% |
40.56% |
39.73% |
|
Jun 17 - 30 |
38.17% |
32.93% |
34.51% |
41.25% |
33.31% |
37.45% |
41.03% |
|
Jul 1 - 14 |
41.72% |
34.43% |
36.18% |
42.80% |
34.81% |
44.53% |
45.30% |
|
Jul 15 - 28 |
41.46% |
35.74% |
35.64% |
42.52% |
34.84% |
43.85% |
44.35% |
|
Jul 29 - Aug 11 |
42.59% |
36.58% |
37.06% |
41.07% |
35.01% |
46.95% |
45.62% |
|
Aug 12 - Aug 25 |
43.58% | 38.47% | 38.68% | 43.84% | 35.27% | 43.99% | 43.58% |
|
Aug 26 - Sep 8 |
44.06% | 36.81% | 39.38% | 43.39% | 35.50% | 51.50% | 45.92% |
|
Sep 9 - Sep 22 |
42.84% | 38.46% | 39.02% | 43.69% | 33.76% | 46.07% | 44.06% |
|
Sep 23 - Oct 6 |
42.71% | 37.87% | 38.61% | 42.28% | 35.51% | 45.72% | 48.30% |
|
Oct 7 - Oct 20 |
41.76% | 37.21% | 37.72% | 44.24% | 34.38% | 45.48% | 45.13% |
|
Oct 21 - Nov 3 |
43.37% | 42.20% | 40.82% | 45.18% | 38.97% | 50.38% | 49.22% |
|
Nov 4 - Nov 17 |
44.59% | 42.65% | 41.78% | 48.90% | 38.62% | 52.17% | 51.20% |
|
Nov 18 - Dec 1 |
44.77% | 41.39% | 41.90% | 46.98% | 39.18% | 51.38% | 50.44% |
|
Dec 2 - Dec 15 |
45.11% | 41.11% | 40.77% | 45.62% | 37.84% | 52.67% | 48.41% |
|
Dec 16 - Dec 29 |
45.54% |
42.03% |
41.04% | 47.37% | 38.65% | 46.65% | 48.77% |
|
May Average |
38.38% |
30.30% |
31.70% |
39.21% |
29.17% |
38.94% |
40.65% |
|
June Average |
38.54% |
32.78% |
34.97% |
42.23% |
33.59% |
39.78% |
40.65% |
|
July Average |
41.75% |
35.35% |
35.90% |
42.39% |
34.79% |
44.39% |
44.78% |
|
Avg August |
43.38% | 37.40% | 38.26% | 42.53% | 35.28% | 46.68% | 45.05% |
|
Avg September |
43.01% | 37.78% | 38.94% | 43.61% | 33.58% | 47.40% | 45.43% |
|
Avg October |
42.44% | 38.79% | 38.66% | 43.58% | 35.60% | 46.33% | 47.19% |
|
Avg November |
44.51% | 42.23% | 42.09% | 48.21% | 39.50% | 52.70% | 50.60% |
|
Avg December |
45.15% | 41.77% | 41.04% | 46.10% | 38.11% | 49.41% | 48.87% |
|
2020 Average |
42.36% | 37.44% | 37.95% | 43.71% | 35.32% | 46.27% | 46.07% |
|
2019 Average |
37.97% |
30.55% |
31.85% |
39.44% |
30.56% |
38.77% |
42.06% |
*Cells highlighted in yellow where N < 100 people.
Main Concerns by Race/Ethnicity
Beginning in April 2020, MHA included the question "Think about your mental health test. What are the main things contributing to your mental health problems right now? Choose up to three," to the optional demographic questions following each screen. In mid-June 2020, "Racism" was added as an option for screeners to select.
From June-December 2020, Black or African American screeners who screened positive or moderate to severe for a mental health condition were most likely to say that racism was one of their top three concerns (19%, N=18,351), followed by screeners identifying as more than one race (12%, N=7,613) and Native American or American Indian screeners (10%, N=1,457).
Among the 1,129,790 screeners who scored positive or moderate to severe for a mental health condition and reported their race/ethnicity from May-December 2020:
- Screeners who identified as more than one race were most likely out of all racial/ethnic groups to select current events (28%) as one of their top three concerns, followed by White screeners (27%) and Hispanic or Latinx screeners (26%).
- Black or African American screeners were most likely to select financial problems (30%), followed by Native American or American Indian screeners (25%) and Asian or Pacific Islander screeners (24%).
- Screeners who identified as Hispanic or Latinx were most likely to select loneliness or isolation (74%), followed by screeners who identified with more than one race (73%) and Asian or Pacific Islander screeners (72%).
- Native American or American Indian screeners were most likely to select grief or loss (39%) followed by screeners who identified as more than one race (29%), and Black or African American screeners (29%).
- Native American or American Indian screeners were most likely to select past trauma (63%), followed by screeners who identified as more than one race (59%) and Hispanic or Latinx screeners (55%).
- Native American or American Indian screeners were most likely to select relationship problems (44%) followed by Asian or Pacific Islander screeners (43%) and Black or African American screeners (43%).
- White screeners were most likely to select coronavirus (27%), followed by Hispanic or Latinx screeners (27%) and screeners who identified as more than one race (25%).
|
Any Positive Screen |
Total Count |
Current events |
Financial Problems |
Loneliness or isolation |
Grief or loss of someone or something |
Past trauma |
Relationship problems |
Coronavirus |
|
Asian or Pacific Islander |
176,687 |
21.41% |
24.32% |
71.52% |
24.92% |
45.10% |
42.72% |
22.85% |
|
Black or African American (non-Hispanic) |
91,843 |
22.74% |
30.35% |
69.24% |
28.59% |
53.10% |
42.58% |
23.76% |
|
Hispanic or Latino |
137,783 |
25.53% |
24.30% |
73.88% |
26.17% |
55.10% |
39.93% |
27.10% |
|
More than one of the above |
59,100 |
27.51% |
21.66% |
73.07% |
28.89% |
59.19% |
39.29% |
25.05% |
|
Native American or American Indian |
14,375 |
25.40% |
25.38% |
71.19% |
38.82% |
63.27% |
43.81% |
23.76% |
|
Other |
57,745 |
22.34% |
23.15% |
69.54% |
28.14% |
49.33% |
40.43% |
22.11% |
|
White (non-Hispanic) |
592,257 |
26.99% |
22.54% |
68.40% |
26.98% |
52.07% |
38.98% |
27.11% |