Prevalence of Mental Illness 2023

Prevalence of Mental Illness
A ranking 1-13 for Prevalence indicates a lower prevalence of mental health and substance use issues compared to states that ranked 39-51.
The seven measures that make up the Prevalence Ranking include:
- Adults with Any Mental Illness (AMI)
- Adults with Substance Use Disorder in the Past Year
- Adults with Serious Thoughts of Suicide
- Youth with at Least One Major Depressive Episode (MDE) in the Past Year
- Youth with Substance Use Disorder in the Past Year
- Youth with Serious Thoughts of Suicide
- Youth (Ages 6-17) Flourishing
| Rank Sort descending | State |
|---|---|
| 01 | Georgia |
| 02 | South Carolina |
| 03 | Texas |
| 04 | New Jersey |
| 05 | North Carolina |
| 06 | Delaware |
| 07 | Florida |
| 08 | Maryland |
| 09 | Wisconsin |
| 10 | Kentucky |
| 11 | New York |
| 12 | Hawaii |
| 13 | Mississippi |
| 14 | Pennsylvania |
| 15 | Tennessee |
| 16 | California |
| 17 | Connecticut |
| 18 | Nevada |
| 19 | Arkansas |
| 20 | District of Columbia |
| 21 | Indiana |
| 22 | Alabama |
| 23 | Massachusetts |
| 24 | Louisiana |
| 25 | Michigan |
| 26 | Oklahoma |
| 27 | Rhode Island |
| 28 | Iowa |
| 29 | Virginia |
| 30 | Missouri |
| 31 | Illinois |
| 32 | North Dakota |
| 33 | Colorado |
| 34 | Alaska |
| 35 | New Hampshire |
| 36 | New Mexico |
| 37 | Wyoming |
| 38 | Arizona |
| 39 | West Virginia |
| 40 | Ohio |
| 41 | Minnesota |
| 42 | Maine |
| 43 | Washington |
| 44 | Nebraska |
| 45 | Vermont |
| 46 | Utah |
| 47 | South Dakota |
| 48 | Idaho |
| 49 | Montana |
| 50 | Kansas |
| 51 | Oregon |
Adult Prevalence of Any Mental Illness (AMI) 2023
The state prevalence of adult mental illness ranges from 17.49% in Florida to 29.68% in Utah.
According to SAMHSA, “Any Mental Illness (AMI) is defined as having a diagnosable mental, behavioral, or emotional disorder, other than a developmental or substance use disorder as assessed by the Mental Health Surveillance Study (MHSS) Structured Clinical Interview for the Diagnostic and Statistical Manual of Mental Disorders—Fourth Edition—Research Version—Axis I Disorders (MHSS-SCID), which is based on the 4th edition of the Diagnostic and Statistical Manual of Mental Disorders (DSM-IV). These estimates are based on indicators of AMI rather than direct measures of diagnostic status."
| Rank Sort descending | State | Percentage | Number |
|---|---|---|---|
| 01 | Florida | 17.49 | 2,985,000 |
| 02 | Georgia | 17.55 | 1,397,000 |
| 03 | Maryland | 17.80 | 822,000 |
| 04 | Hawaii | 17.86 | 189,000 |
| 05 | Texas | 17.96 | 3,825,000 |
| 06 | New Jersey | 18.27 | 1,251,000 |
| 07 | Connecticut | 18.77 | 524,000 |
| 08 | New York | 18.83 | 2,855,000 |
| 09 | Pennsylvania | 19.68 | 1,963,000 |
| 10 | North Carolina | 19.80 | 1,592,000 |
| 11 | Tennessee | 20.46 | 1,073,000 |
| 12 | California | 20.49 | 6,169,000 |
| 13 | Virginia | 20.51 | 1,331,000 |
| 14 | Delaware | 20.52 | 156,000 |
| 15 | Illinois | 20.72 | 2,000,000 |
| 16 | North Dakota | 20.79 | 118,000 |
| 17 | Iowa | 21.00 | 503,000 |
| 18 | Mississippi | 21.06 | 465,000 |
| 19 | New Mexico | 21.16 | 337,000 |
| 20 | Louisiana | 21.18 | 733,000 |
| 21 | Alabama | 21.24 | 797,000 |
| 22 | South Dakota | 21.25 | 139,000 |
| 23 | Missouri | 21.32 | 996,000 |
| 24 | Nevada | 21.38 | 508,000 |
| 25 | Massachusetts | 21.39 | 1,172,000 |
| 26 | Maine | 21.61 | 234,000 |
| 27 | South Carolina | 21.69 | 862,000 |
| 28 | Indiana | 21.83 | 1,109,000 |
| 29 | Wisconsin | 21.83 | 982,000 |
| 30 | Kentucky | 21.91 | 742,000 |
| 31 | Alaska | 22.20 | 117,000 |
| 32 | Michigan | 22.33 | 1,729,000 |
| 33 | Arkansas | 22.61 | 514,000 |
| 34 | District of Columbia | 22.95 | 131,000 |
| 35 | Colorado | 23.16 | 1,028,000 |
| 36 | Minnesota | 23.23 | 997,000 |
| 37 | Nebraska | 23.41 | 335,000 |
| 38 | Montana | 23.43 | 195,000 |
| 39 | Wyoming | 23.63 | 103,000 |
| 40 | Vermont | 23.71 | 120,000 |
| 41 | New Hampshire | 23.74 | 260,000 |
| 42 | Arizona | 23.89 | 1,339,000 |
| 43 | Rhode Island | 24.12 | 202,000 |
| 44 | Ohio | 24.32 | 2,177,000 |
| 45 | Idaho | 24.92 | 333,000 |
| 46 | Washington | 25.51 | 1,500,000 |
| 47 | Oklahoma | 25.59 | 752,000 |
| 48 | Kansas | 26.02 | 560,000 |
| 49 | West Virginia | 26.05 | 366,000 |
| 50 | Oregon | 27.33 | 909,000 |
| 51 | Utah | 29.68 | 675,000 |
| 52 | National | 20.78 | 52,173,000 |
Adults with Substance Use Disorder 2023
Adults with Substance Use Disorder in the Past Year
17.82% of adults in the U.S. had a substance use disorder in the past year, totaling over 45 million people.
9.41% of adults in America had a drug use disorder in the past year.
11.28% of adults in America had an alcohol use disorder in the past year.
The state prevalence of adults with substance use disorder ranges from 14.15% in Utah to 24.30% in Alaska.
According to SAMHSA, “Substance Use Disorder (SUD) estimates are based on Diagnostic and Statistical Manual of Mental Disorders, 5th edition criteria. SUD is defined as meeting the criteria for drug or alcohol use disorder. Beginning with the 2021 National Survey on Drug Use and Health, questions on prescription drug use disorder were asked of all past year users of prescription drugs, regardless of whether they misused prescription drugs.”
| Rank Sort descending | State | Percentage | Number |
|---|---|---|---|
| 01 | Georgia | 11.31 | 906,000 |
| 02 | Texas | 11.93 | 2,564,000 |
| 03 | Utah | 12.64 | 291,000 |
| 04 | Kentucky | 12.98 | 441,000 |
| 05 | North Carolina | 13.48 | 1,092,000 |
| 06 | Hawaii | 13.77 | 145,000 |
| 07 | Tennessee | 13.94 | 734,000 |
| 08 | South Carolina | 14.08 | 564,000 |
| 09 | Virginia | 14.53 | 947,000 |
| 10 | Indiana | 14.61 | 745,000 |
| 11 | Florida | 14.81 | 2,541,000 |
| 12 | Arkansas | 14.85 | 339,000 |
| 13 | New York | 14.88 | 2,250,000 |
| 14 | West Virginia | 14.93 | 210,000 |
| 15 | Alabama | 14.94 | 563,000 |
| 16 | Nevada | 14.95 | 360,000 |
| 17 | Idaho | 15.02 | 204,000 |
| 18 | Maryland | 15.27 | 706,000 |
| 19 | Ohio | 15.36 | 1,377,000 |
| 20 | New Jersey | 15.37 | 1,052,000 |
| 21 | Mississippi | 15.47 | 341,000 |
| 22 | Delaware | 15.57 | 120,000 |
| 23 | Iowa | 15.73 | 378,000 |
| 24 | Wisconsin | 15.88 | 717,000 |
| 25 | Missouri | 15.93 | 746,000 |
| 26 | Pennsylvania | 15.94 | 1,589,000 |
| 27 | Oklahoma | 16.07 | 474,000 |
| 28 | Arizona | 16.25 | 923,000 |
| 29 | North Dakota | 16.37 | 93,000 |
| 30 | Louisiana | 16.43 | 569,000 |
| 31 | Alaska | 16.57 | 87,000 |
| 32 | New Mexico | 16.58 | 265,000 |
| 33 | Rhode Island | 16.66 | 140,000 |
| 34 | Connecticut | 16.66 | 465,000 |
| 35 | Illinois | 16.69 | 1,607,000 |
| 36 | California | 16.70 | 5,027,000 |
| 37 | Michigan | 16.72 | 1,295,000 |
| 38 | New Hampshire | 17.00 | 186,000 |
| 39 | Colorado | 17.25 | 771,000 |
| 40 | Minnesota | 17.26 | 742,000 |
| 41 | Maine | 17.32 | 188,000 |
| 42 | Massachusetts | 17.41 | 955,000 |
| 43 | Wyoming | 17.57 | 77,000 |
| 44 | Vermont | 17.69 | 89,000 |
| 45 | Nebraska | 18.00 | 258,000 |
| 46 | Kansas | 18.42 | 398,000 |
| 47 | South Dakota | 18.55 | 122,000 |
| 48 | Washington | 18.59 | 1,100,000 |
| 49 | Oregon | 19.13 | 639,000 |
| 50 | Montana | 19.22 | 161,000 |
| 51 | District of Columbia | 21.21 | 122,000 |
| 52 | National | 15.35 | 38,679,000 |
Adults with Serious Thoughts of Suicide 2023
5.04% of adults reported experiencing serious thoughts of suicide. The estimated number of adults with serious suicidal thoughts in the U.S. is over 12.8 million.
After slight decreases in suicide deaths in 2019 and 2020, the number of individuals who died by suicide in 2022 was the highest number ever recorded in the U.S.
The state prevalence of adults with serious thoughts of suicide ranges from 4.16% in Connecticut to 7.12% in Utah.
| Rank Sort descending | State | Percentage | Number |
|---|---|---|---|
| 01 | Georgia | 3.92 | 313,000 |
| 02 | New Jersey | 4.12 | 283,000 |
| 03 | Texas | 4.18 | 892,000 |
| 04 | Florida | 4.26 | 727,000 |
| 05 | North Carolina | 4.30 | 346,000 |
| 06 | District of Columbia | 4.30 | 25,000 |
| 07 | New York | 4.34 | 659,000 |
| 08 | California | 4.39 | 1,323,000 |
| 09 | Connecticut | 4.40 | 123,000 |
| 10 | South Carolina | 4.42 | 176,000 |
| 11 | Louisiana | 4.50 | 156,000 |
| 12 | Illinois | 4.54 | 438,000 |
| 13 | Tennessee | 4.58 | 240,000 |
| 14 | Virginia | 4.58 | 298,000 |
| 15 | New Hampshire | 4.62 | 50,000 |
| 16 | Hawaii | 4.62 | 49,000 |
| 17 | Mississippi | 4.65 | 103,000 |
| 18 | Delaware | 4.65 | 35,000 |
| 19 | Maryland | 4.67 | 216,000 |
| 20 | Massachusetts | 4.74 | 260,000 |
| 21 | New Mexico | 4.82 | 77,000 |
| 22 | Michigan | 4.84 | 375,000 |
| 23 | Wisconsin | 4.85 | 219,000 |
| 24 | Pennsylvania | 4.86 | 485,000 |
| 25 | Kentucky | 4.89 | 166,000 |
| 26 | Alabama | 4.96 | 186,000 |
| 27 | Maine | 5.12 | 56,000 |
| 28 | Rhode Island | 5.17 | 43,000 |
| 29 | Oklahoma | 5.24 | 154,000 |
| 30 | Nebraska | 5.35 | 77,000 |
| 31 | Iowa | 5.38 | 129,000 |
| 32 | Vermont | 5.40 | 27,000 |
| 33 | West Virginia | 5.42 | 76,000 |
| 34 | Missouri | 5.47 | 256,000 |
| 35 | Nevada | 5.52 | 131,000 |
| 36 | Arkansas | 5.59 | 127,000 |
| 37 | Washington | 5.62 | 331,000 |
| 38 | North Dakota | 5.62 | 32,000 |
| 39 | Indiana | 5.82 | 296,000 |
| 40 | Minnesota | 5.96 | 256,000 |
| 41 | Colorado | 6.01 | 267,000 |
| 42 | Ohio | 6.01 | 538,000 |
| 43 | Wyoming | 6.02 | 26,000 |
| 44 | South Dakota | 6.08 | 40,000 |
| 45 | Alaska | 6.15 | 32,000 |
| 46 | Montana | 6.24 | 52,000 |
| 47 | Idaho | 6.27 | 84,000 |
| 48 | Kansas | 6.44 | 139,000 |
| 49 | Arizona | 6.48 | 364,000 |
| 50 | Oregon | 6.80 | 226,000 |
| 51 | Utah | 7.63 | 174,000 |
| 52 | National | 4.84 | 12,151,000 |
Youth with At Least One Major Depressive Episode (MDE) 2023
Youth with at Least One Past Year Major Depressive Episode (MDE)
20.17% of youth (ages 12-17) reported suffering from at least one major depressive episode (MDE) in the past year.
15% of youth in the U.S. experienced an MDE with severe impairment, meaning it severely impacted their functioning at work, school, or home.
The state prevalence of youth with MDE ranges from 16.02% in the District of Columbia to 24.96% in Oregon.
| Rank Sort descending | State | Percentage | Number |
|---|---|---|---|
| 01 | New Jersey | 12.57 | 84,000 |
| 02 | South Carolina | 13.41 | 51,000 |
| 03 | Pennsylvania | 14.04 | 127,000 |
| 04 | Wisconsin | 14.16 | 63,000 |
| 05 | Delaware | 14.24 | 10,000 |
| 06 | Georgia | 14.49 | 127,000 |
| 07 | California | 14.83 | 447,000 |
| 08 | Kentucky | 14.89 | 51,000 |
| 09 | Arkansas | 14.97 | 36,000 |
| 10 | Mississippi | 15.08 | 37,000 |
| 11 | Maryland | 15.37 | 69,000 |
| 12 | Indiana | 15.45 | 83,000 |
| 13 | Florida | 15.51 | 225,000 |
| 14 | North Carolina | 15.56 | 124,000 |
| 15 | Connecticut | 15.64 | 42,000 |
| 16 | Rhode Island | 15.90 | 11,000 |
| 17 | Oklahoma | 15.97 | 51,000 |
| 18 | Michigan | 15.99 | 119,000 |
| 19 | Nevada | 16.02 | 38,000 |
| 20 | New York | 16.03 | 214,000 |
| 21 | Louisiana | 16.18 | 58,000 |
| 22 | District of Columbia | 16.32 | 5,000 |
| 23 | Wyoming | 16.78 | 8,000 |
| 24 | Missouri | 16.84 | 79,000 |
| 25 | Arizona | 16.90 | 96,000 |
| 26 | New Hampshire | 17.02 | 16,000 |
| 27 | Colorado | 17.05 | 74,000 |
| 28 | Texas | 17.08 | 429,000 |
| 29 | Iowa | 17.10 | 42,000 |
| 30 | Tennessee | 17.32 | 89,000 |
| 31 | Alabama | 17.56 | 65,000 |
| 32 | Massachusetts | 17.74 | 84,000 |
| 33 | North Dakota | 17.77 | 10,000 |
| 34 | West Virginia | 17.92 | 22,000 |
| 35 | Kansas | 17.94 | 43,000 |
| 36 | South Dakota | 17.96 | 13,000 |
| 37 | Illinois | 18.10 | 177,000 |
| 38 | Ohio | 18.25 | 162,000 |
| 39 | Alaska | 18.36 | 10,000 |
| 40 | Hawaii | 18.36 | 17,000 |
| 41 | Utah | 19.08 | 61,000 |
| 42 | New Mexico | 19.32 | 32,000 |
| 43 | Minnesota | 19.39 | 86,000 |
| 44 | Virginia | 19.56 | 124,000 |
| 45 | Washington | 19.57 | 108,000 |
| 46 | Maine | 19.85 | 18,000 |
| 47 | Nebraska | 20.08 | 32,000 |
| 48 | Montana | 20.18 | 16,000 |
| 49 | Vermont | 20.64 | 8,000 |
| 50 | Idaho | 20.88 | 33,000 |
| 51 | Oregon | 21.13 | 63,000 |
| 52 | National | 16.39 | 4,087,000 |
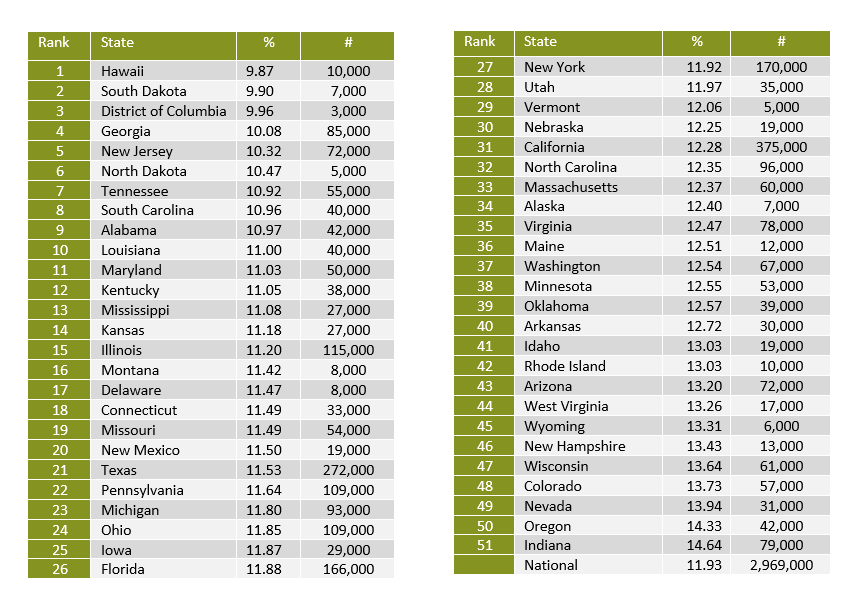
Youth with Severe Major Depressive Episode 2023
11.5% of youth (or over 2.7 million youth) are experiencing severe major depression.
Rates of a severe major depressive episode were highest among youth who identified as more than one race, at 16.5% (about 123,000 youth).
The percentage of youth with severe major depressive episode in South Dakota (ranked 51) is nearly four times the percentage of youth with severe MDE in South Carolina (ranked 1).
The state prevalence of youth with Severe MDE ranges from 5.2% in South Carolina to 19.9% in South Dakota.
| Rank Sort descending | State | Percentage | Number |
|---|---|---|---|
| 01 | South Carolina | 5.20% | 19,000 |
| 02 | New Jersey | 7.50% | 48,000 |
| 03 | Mississippi | 8.10% | 19,000 |
| 04 | Wisconsin | 8.50% | 37,000 |
| 05 | Massachusetts | 8.80% | 40,000 |
| 06 | California | 9.20% | 269,000 |
| 07 | Pennsylvania | 9.20% | 79,000 |
| 08 | Kentucky | 9.30% | 30,000 |
| 09 | Rhode Island | 9.90% | 7,000 |
| 10 | Georgia | 10.00% | 85,000 |
| 11 | Delaware | 10.10% | 7,000 |
| 12 | Connecticut | 10.20% | 26,000 |
| 13 | Oklahoma | 10.30% | 32,000 |
| 14 | Arkansas | 10.60% | 25,000 |
| 15 | District of Columbia | 10.60% | 3,000 |
| 16 | North Carolina | 10.60% | 82,000 |
| 17 | Tennessee | 10.60% | 54,000 |
| 18 | Wyoming | 10.70% | 5,000 |
| 19 | New York | 10.80% | 137,000 |
| 20 | Texas | 10.80% | 261,000 |
| 21 | Colorado | 10.90% | 46,000 |
| 22 | Hawaii | 10.90% | 10,000 |
| 23 | Indiana | 11.20% | 57,000 |
| 24 | Michigan | 11.30% | 83,000 |
| 25 | Florida | 12.30% | 174,000 |
| 26 | Maryland | 12.40% | 55,000 |
| 27 | New Mexico | 12.80% | 21,000 |
| 28 | Kansas | 13.00% | 30,000 |
| 29 | West Virginia | 13.00% | 16,000 |
| 30 | Arizona | 13.10% | 72,000 |
| 31 | Alabama | 13.20% | 48,000 |
| 32 | New Hampshire | 13.30% | 12,000 |
| 33 | Montana | 13.40% | 10,000 |
| 34 | North Dakota | 13.60% | 7,000 |
| 35 | Missouri | 13.80% | 64,000 |
| 36 | Nevada | 13.80% | 32,000 |
| 37 | Ohio | 13.90% | 119,000 |
| 38 | Vermont | 13.90% | 5,000 |
| 39 | Washington | 14.00% | 74,000 |
| 40 | Illinois | 14.40% | 136,000 |
| 41 | Alaska | 14.80% | 8,000 |
| 42 | Iowa | 15.00% | 36,000 |
| 43 | Minnesota | 15.20% | 64,000 |
| 44 | Nebraska | 15.70% | 23,000 |
| 45 | Virginia | 15.70% | 97,000 |
| 46 | Maine | 16.30% | 14,000 |
| 47 | Utah | 16.40% | 50,000 |
| 48 | Louisiana | 16.60% | 59,000 |
| 49 | Idaho | 17.50% | 27,000 |
| 50 | Oregon | 19.00% | 55,000 |
| 51 | South Dakota | 19.90% | 14,000 |
| 52 | National | 11.50% | 2,782,000 |
Youth with Substance Use Disorder 2023
6.34% of youth in the U.S. reported a substance use disorder in the past year.
2.85% had an alcohol use disorder in the past year, while 4.85% had an illicit drug use disorder.
The state prevalence of youth with substance use disorder ranges from 3.94% in the District of Columbia to 9.05% in Kansas.
| Rank Sort descending | State | Percentage | Number |
|---|---|---|---|
| 01 | District of Columbia | 3.94 | 1,000 |
| 02 | Georgia | 4.30 | 38,000 |
| 03 | Nevada | 4.65 | 11,000 |
| 04 | Alaska | 5.06 | 3,000 |
| 05 | North Carolina | 5.13 | 41,000 |
| 06 | Delaware | 5.13 | 4,000 |
| 07 | South Carolina | 5.26 | 20,000 |
| 08 | Maryland | 5.27 | 24,000 |
| 09 | Wisconsin | 5.66 | 25,000 |
| 10 | Utah | 5.70 | 18,000 |
| 11 | Minnesota | 5.73 | 25,000 |
| 12 | Texas | 5.79 | 146,000 |
| 13 | Florida | 5.99 | 87,000 |
| 14 | Louisiana | 6.00 | 22,000 |
| 15 | Arizona | 6.06 | 35,000 |
| 16 | Oklahoma | 6.07 | 20,000 |
| 17 | Hawaii | 6.08 | 6,000 |
| 18 | Alabama | 6.11 | 23,000 |
| 19 | Tennessee | 6.13 | 32,000 |
| 20 | Washington | 6.27 | 35,000 |
| 21 | Arkansas | 6.29 | 15,000 |
| 22 | Colorado | 6.37 | 28,000 |
| 23 | Mississippi | 6.48 | 16,000 |
| 24 | New York | 6.49 | 86,000 |
| 25 | Indiana | 6.49 | 35,000 |
| 26 | Iowa | 6.52 | 16,000 |
| 27 | North Dakota | 6.53 | 4,000 |
| 28 | Kentucky | 6.59 | 22,000 |
| 29 | Rhode Island | 6.60 | 5,000 |
| 30 | California | 6.64 | 200,000 |
| 31 | Massachusetts | 6.77 | 32,000 |
| 32 | Ohio | 6.81 | 60,000 |
| 33 | Missouri | 6.81 | 32,000 |
| 34 | Pennsylvania | 6.85 | 62,000 |
| 35 | Wyoming | 6.90 | 3,000 |
| 36 | West Virginia | 6.96 | 9,000 |
| 37 | Virginia | 6.99 | 44,000 |
| 38 | Idaho | 7.06 | 11,000 |
| 39 | Nebraska | 7.13 | 11,000 |
| 40 | Michigan | 7.14 | 53,000 |
| 41 | Illinois | 7.19 | 70,000 |
| 42 | New Jersey | 7.26 | 49,000 |
| 43 | South Dakota | 7.37 | 5,000 |
| 44 | New Hampshire | 7.46 | 7,000 |
| 45 | Maine | 7.46 | 7,000 |
| 46 | Connecticut | 7.50 | 20,000 |
| 47 | New Mexico | 7.75 | 13,000 |
| 48 | Vermont | 7.91 | 3,000 |
| 49 | Oregon | 7.97 | 24,000 |
| 50 | Montana | 8.60 | 7,000 |
| 51 | Kansas | 9.05 | 22,000 |
| 52 | National | 6.34 | 1,584,000 |